Eric Busboom.
There is a very high — nearly perfect — relationship between average daily attendance and expense at the district level, $R^2= .988$. This indicates that the number of students in a district almost perfectly explains how much the district spends, leaving very little room for the possibility that ther are other factors that can moderate cost, at least statewide. It also means that if there are significant differences in this relationship for a district, there may be an important difference with that district.
| Dep. Variable: | exp_current | R-squared (uncentered): | 0.986 |
|---|---|---|---|
| Model: | OLS | Adj. R-squared (uncentered): | 0.986 |
| Method: | Least Squares | F-statistic: | 1.921e+05 |
| Date: | Wed, 10 Aug 2022 | Prob (F-statistic): | 0.00 |
| Time: | 12:43:56 | Log-Likelihood: | -49737. |
| No. Observations: | 2743 | AIC: | 9.948e+04 |
| Df Residuals: | 2742 | BIC: | 9.948e+04 |
| Df Model: | 1 | ||
| Covariance Type: | nonrobust |
| coef | std err | t | P>|t| | [0.025 | 0.975] | |
|---|---|---|---|---|---|---|
| ada | 1.253e+04 | 28.589 | 438.317 | 0.000 | 1.25e+04 | 1.26e+04 |
| Omnibus: | 1762.832 | Durbin-Watson: | 1.793 |
|---|---|---|---|
| Prob(Omnibus): | 0.000 | Jarque-Bera (JB): | 87265.597 |
| Skew: | 2.395 | Prob(JB): | 0.00 |
| Kurtosis: | 30.214 | Cond. No. | 1.00 |
Notes:
[1] R² is computed without centering (uncentered) since the model does not contain a constant.
[2] Standard Errors assume that the covariance matrix of the errors is correctly specified.
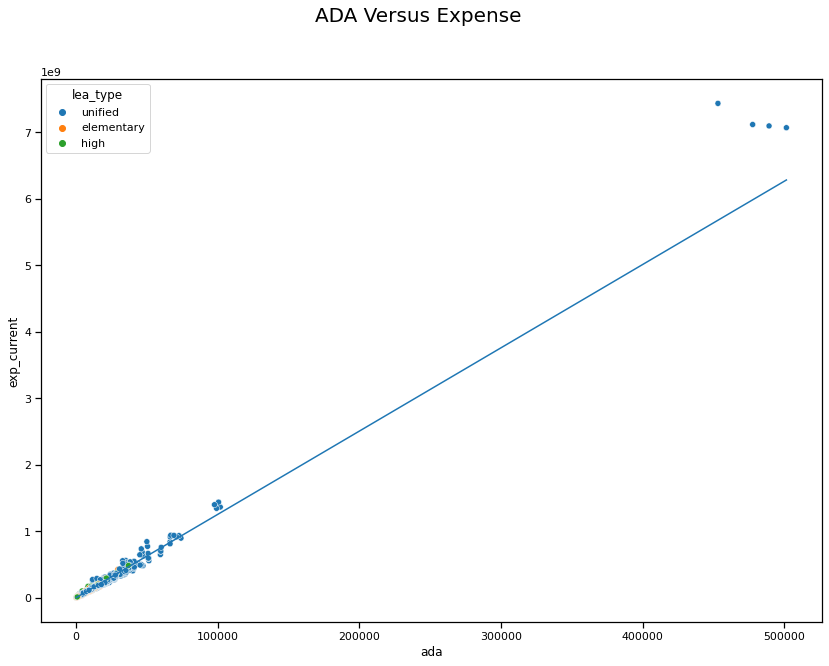
The four points in the far upper right are four years of recors for Los Angeles Unified.