Eric Busboom.
The variable used in the following charts are:
score_all: Test score averaged across all students in the districtscore_ses: Test score of high socioeconomic static students (SES) minus low-SES students; the gap between rich an dpoor.score_wb: Test score of white students minus the test score of black students; the white-black gap.
staff_black_rate: Percetage of teachers who are blackstaff_hisp_rate: Percentage of teachers who are asian.staff_whasian_rate: Percentage of teachers who are white or asian.staff_male_rate: Percentage of teachers who are malestaff_teacher_rate: Ratio of teachers to total staff.
This analysis is limited to districts where the annual cost per student is less than $20,000, which excludes very small districts that have unusual circumstances and should be analyzed independently.
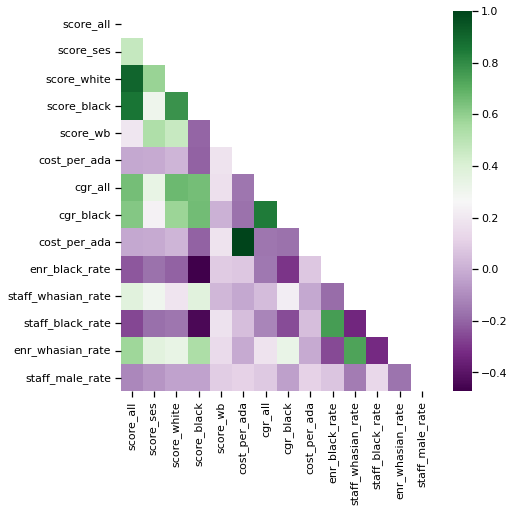
Correlation Matrix
<AxesSubplot:>
Detailed Correlations
These tables show the correlations between the variables in the a and b columns.
More asian and white teachers are correlated with higher test scores across all categories. More asian white teachers has a moderate association with increasing college rate for black students, but much less so for other students.
| a | b | corr | |
|---|---|---|---|
| 19 | staff_whasian_rate | score_all | 0.370149 |
| 20 | staff_whasian_rate | score_black | 0.369934 |
| 26 | staff_whasian_rate | score_ses | 0.302490 |
| 28 | staff_whasian_rate | cgr_black | 0.221133 |
| 30 | staff_whasian_rate | score_white | 0.183244 |
| 48 | staff_whasian_rate | cgr_all | 0.044013 |
| 49 | staff_whasian_rate | score_wb | 0.022123 |
| 59 | staff_whasian_rate | cost_per_ada | -0.024438 |
| 77 | staff_whasian_rate | enr_black_rate | -0.180846 |
Higher per-student spending is associated with higher scores for white students and lower scores for black students.
| a | b | corr | |
|---|---|---|---|
| 0 | cost_per_ada | cost_per_ada | 1.000000 |
| 31 | cost_per_ada | score_wb | 0.182259 |
| 50 | cost_per_ada | score_white | 0.018462 |
| 55 | cost_per_ada | score_ses | -0.018445 |
| 57 | cost_per_ada | score_all | -0.021149 |
| 70 | cost_per_ada | cgr_all | -0.157765 |
| 74 | cost_per_ada | cgr_black | -0.170933 |
| 80 | cost_per_ada | score_black | -0.207649 |
More black teachers is associated with lower scores for black students and a lower rate of college for black students.
| a | b | corr | |
|---|---|---|---|
| 5 | staff_black_rate | enr_black_rate | 0.750346 |
| 34 | staff_black_rate | score_wb | 0.171786 |
| 46 | staff_black_rate | cost_per_ada | 0.049291 |
| 66 | staff_black_rate | cgr_all | -0.121854 |
| 71 | staff_black_rate | score_white | -0.162522 |
| 76 | staff_black_rate | score_ses | -0.176879 |
| 83 | staff_black_rate | cgr_black | -0.251551 |
| 85 | staff_black_rate | score_all | -0.263363 |
| 88 | staff_black_rate | staff_whasian_rate | -0.339720 |
| 89 | staff_black_rate | score_black | -0.441095 |
More male teachers is associated with higher scores for black students.
| a | b | corr | |
|---|---|---|---|
| 37 | staff_male_rate | staff_black_rate | 0.131872 |
| 38 | staff_male_rate | cost_per_ada | 0.112925 |
| 40 | staff_male_rate | score_wb | 0.091101 |
| 42 | staff_male_rate | cgr_all | 0.080405 |
| 45 | staff_male_rate | enr_black_rate | 0.068373 |
| 61 | staff_male_rate | score_black | -0.037697 |
| 62 | staff_male_rate | score_white | -0.041318 |
| 63 | staff_male_rate | cgr_black | -0.044097 |
| 64 | staff_male_rate | score_ses | -0.075816 |
| 65 | staff_male_rate | score_all | -0.115924 |
| 67 | staff_male_rate | staff_whasian_rate | -0.145117 |
| 72 | staff_male_rate | enr_whasian_rate | -0.167281 |
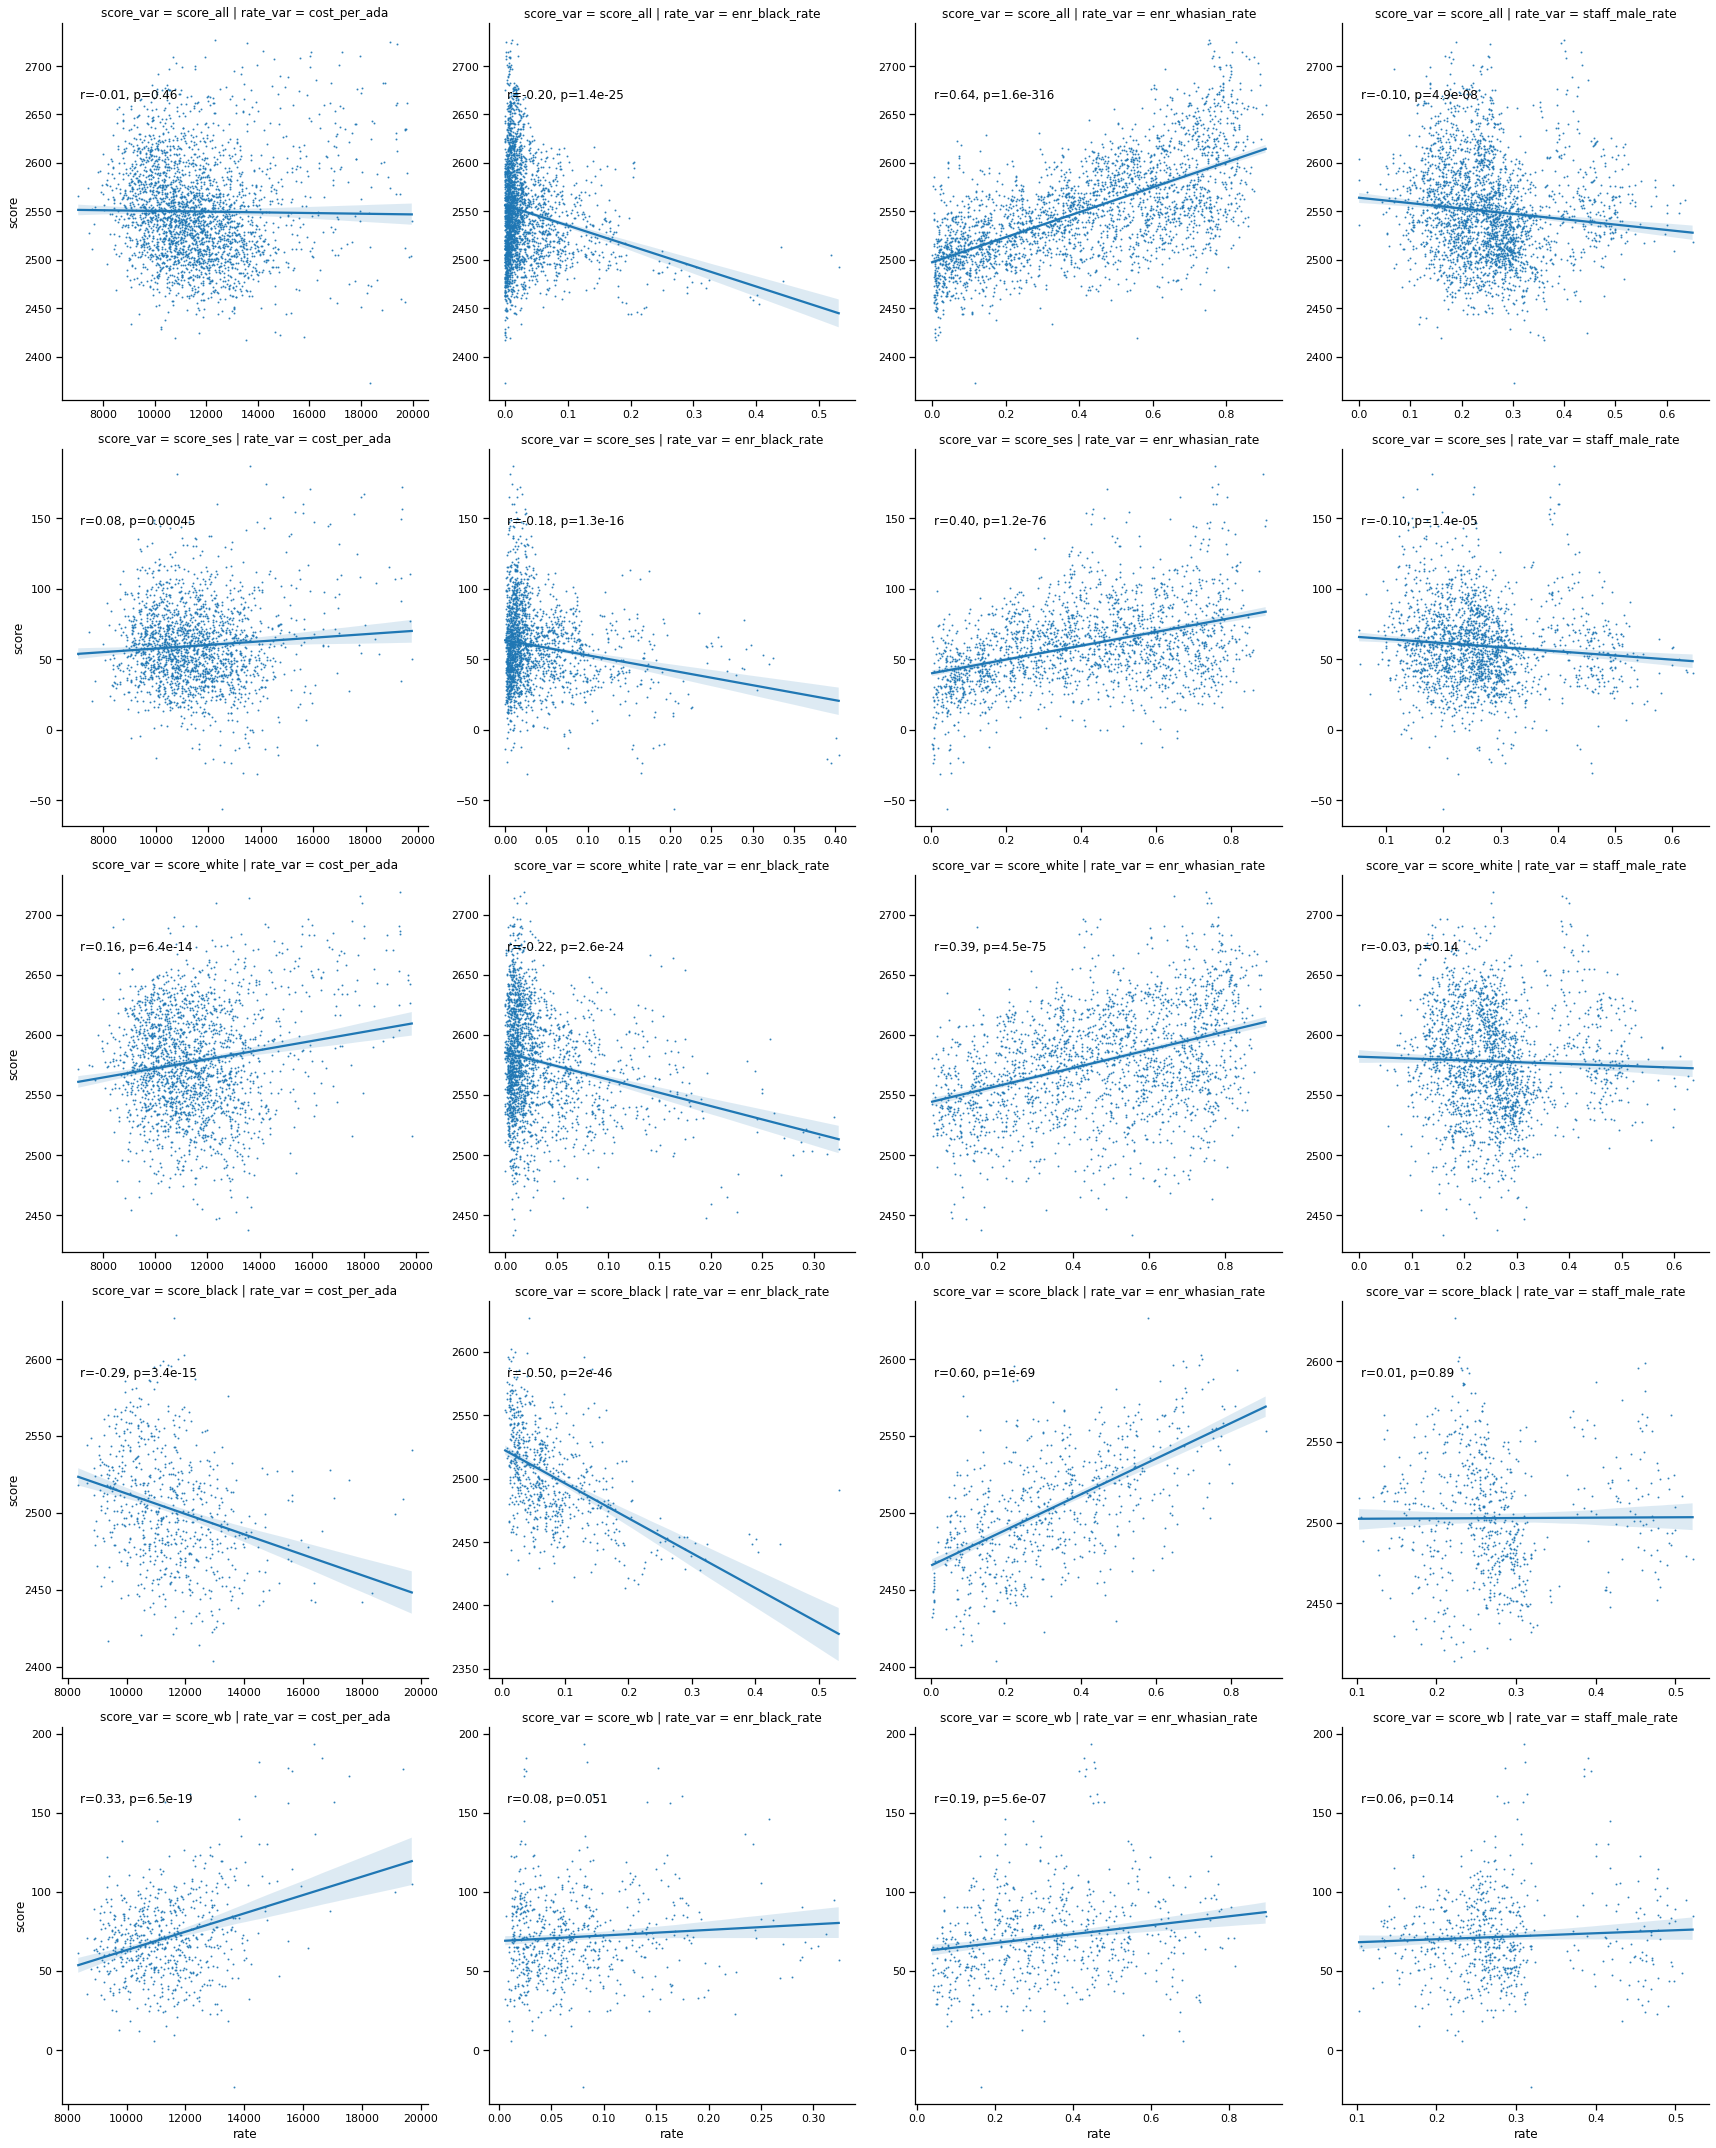
Detailed Regression Plots
Detailed scatter plots with a regresion line for pairs of variables. The two variables are shown in the title of each plot, where score_var is the name of variable on the y axis, and rate_var is the variable on the x axis.
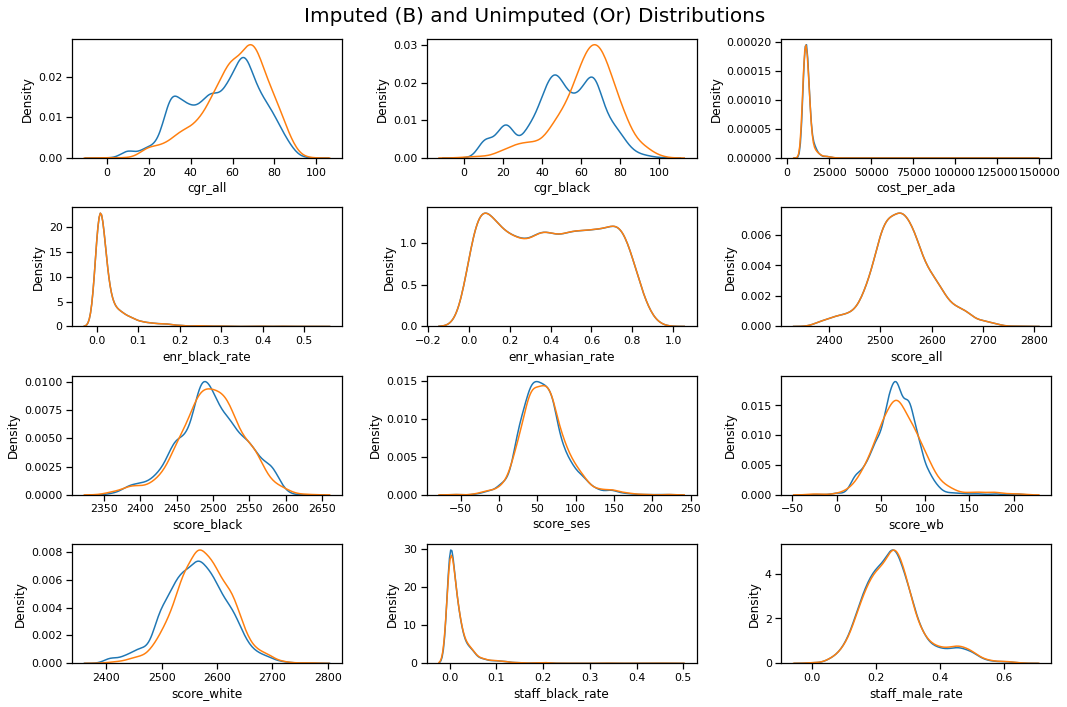
Imputation Test
There are a lot of missing data, so it may be worth while to impute missing records. This grid of KDE plots shows the oroginal data series in orange, and the imputed ( KNN, n=2 ) data series in blue. Plots for variables where the blue and orange curves align exactly do not require imputation, and where the lines diverge greatly ( such as cgr_black ) the imputation is probably adversely affecting the statistics.